The public benchmark for water loss in Brazil is roughly 40% of treated water that never reaches the consumer as billed volume (ANA, Trata Brasil, SNIS). The discussion usually treats that number as synonymous with network leaks. Part of the problem, though, has a different origin: it's water that reached the consumer, was consumed, but wasn't correctly registered by the meter. For the water balance, it lands in the wrong column.
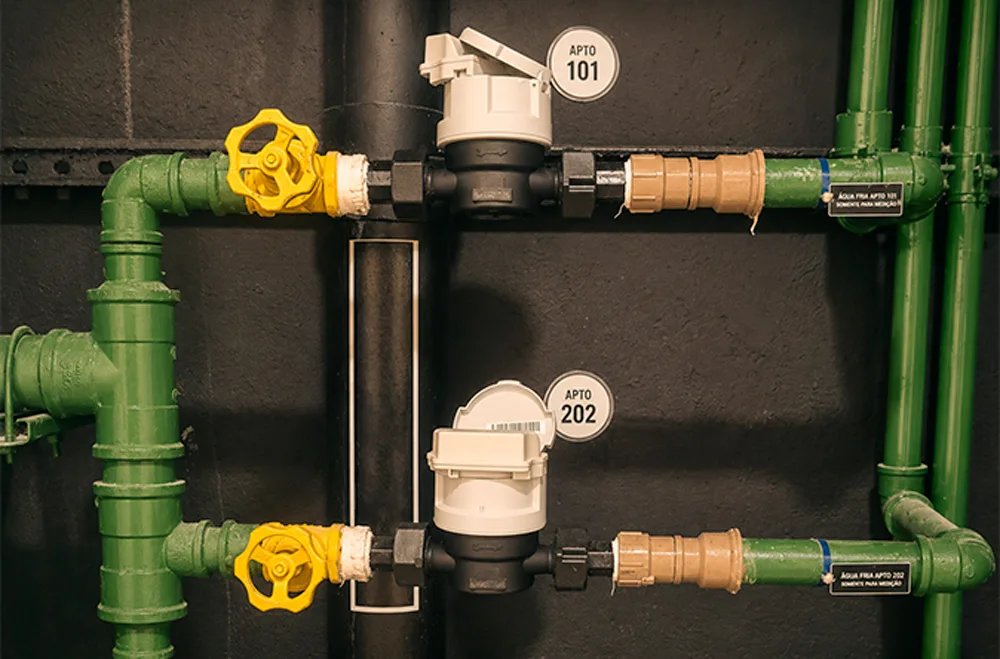
That distinction matters to whoever operates a metering fleet. Real loss and apparent loss have different causes, different diagnoses, and different responses. A network leak calls for fieldwork, excavation, and repair. An under-registering meter calls for detection, prioritization criteria, and replacement at the right time. Treating both as the same problem wastes resources in the wrong places.
What the data shows
In April 2026, Group Link One's platform flagged anomalous behavior across two metering fleets belonging to partner clients who opened their bases for joint analysis. In the first, 307 meters showed some type of anomaly within a single month: sudden reading drops, anomalous consumption spikes, and — the most frequent category — 242 cases of gradual degradation. In the second, larger client, the number reached more than 1,700 devices with irregular behavior, 1,133 of them in the gradual-degradation category.
Gradual degradation is the kind of anomaly that never triggers an operational alert. The curve slides down slowly, over weeks. Without enough reading density to separate trend from noise, it stays invisible.
To put a number on the scale of the problem: a statistical model run over 850 meters across thirteen months found a decay coefficient of 1.3% per month of age (p < 0.001). Small residential meters have a 1.94 times higher hazard ratio of crossing the degradation threshold compared to large consumers. That water was delivered to the consumer. It just wasn't billed because the meter counted less than it should have.
“That water was delivered to the consumer. It just wasn't billed because the meter counted less than it should have.”
Why reading frequency is the central factor
Every statistical analysis behind these findings depends on a single variable: how many readings per day feed the model. More readings mean a smaller standard error, a finer signal, and the ability to tell a real 1.3%-per-month decline apart from the normal sample noise of a fleet with hundreds of devices.
Projections run for different density configurations make this concrete: at 1 reading per day, the typical range for low-frequency solutions, gradual-degradation detection drops 70% to 85%. At 4 readings per day, the pattern for many market networks, it drops 30% to 50%. From 24 readings per day on, the signal starts showing up consistently. Above 50 readings per day, detection coverage reaches 85%–95% of identifiable cases.
Meeting the regulatory target and building a data base dense enough to detect root cause are two different decisions. They look the same in the tender. In practice, they aren't.
When detection is possible, the field team leaves with a list. Instead of working through the fleet by meter age or customer complaint, the technician goes to the devices the data flagged with statistical confidence. In the operations described here, that list held 242 cases in a mid-sized fleet, and more than 1,700 in a larger operation. A manageable volume, with prioritization criteria already built in.
The OPEX reduction in reading, re-reading, and auditing that telemetry delivers is already well documented. What these findings add is a different layer: the ability to identify where apparent loss is accumulating before it becomes a problem in the annual water balance. The right meter, at the right time, with the evidence to justify the decision.
About the author
Thiago Rondon
COO and CTO of Group Link One. He has worked for more than 25 years in software development, distributed systems, IoT, and large-scale data platforms.